Category Archives: Development

jMRUI 7.0 released

We are happy to announce the new jMRUI version 7.0

This new version comes loaded with many improvements and new features, amongst the most important:

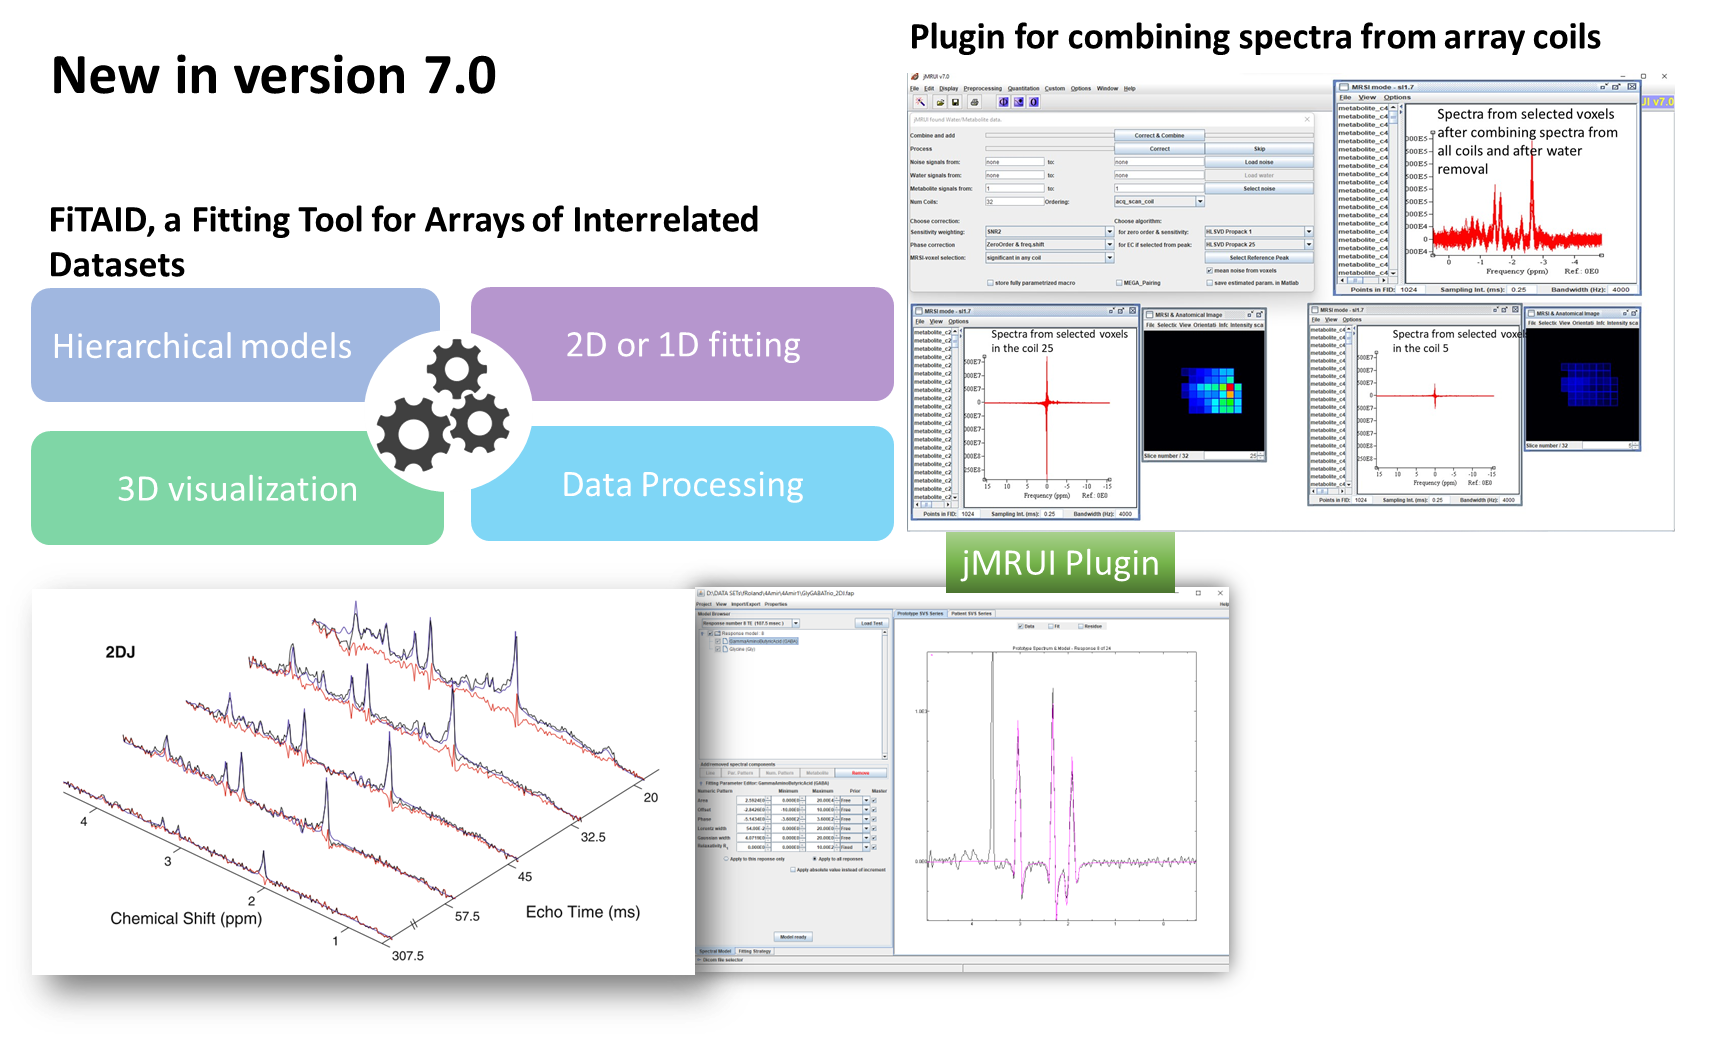
  • FiTAID – Fitting Tool for Arrays of Interrelated Datasets. A new plugin for multidimensional, interrelated spectra quantification: models for 1D, 2D and multidimensional fitting (Saturation recovery, Inversion recovery, 2DJ,  2DJ diffusion, 2DJIR); flexible construction of the signal model with metabolite profiles defined as combinations of simulated signal profile(s) (simulated, e.g., in VeSPA, NMRScopeB (jMRUI)) and/or resonance peaks (Gaussian, Lorentzian, Voigt shapes); possibility to set various constraints on estimated parameters; possibility to select the fitting strategy (e.g. fitting domain, simultaneous or individual fit, algorithm, fitting region etc.); visualization tools for multidimensional data; batch processing of large multi-dimensional MRS data;
  • Flexible algorithm for combining spectra from array coils, tested for GE and Bruker raw data
  • plugin for phase and frequency correction of SV or MRSI spectra, based on a selected peak;
  • improved handling and processing of multi-slice MRSI data;
  • QUASARY (improved QUASARX), i.e., QUASAR with a choice of Gaussian or Lorentzian lineshape, common damping for selected metabolites, fixed amplitude ratios between selected metabolites;
  • AMARES is now accessible from the plugin SpectrIm and the resulting metabolite maps obtained in AMARES can be imported back into SpectrIm for visualization; the AMARES starting values, peak positions, and other prior knowledge can be saved/loaded as text files with a single click;
  • NMRScopeB implemented with Python3, with improved protocols;
  • support of new data formats: Bruker PV360, new GE data format, MRS-NIfTI data standard format in jMRUI; option to store/load quantification results and simulated spectra in JSON/NIfTI format; spectra including MRSI data can be saved in Matlab; Philips Advanced DICOM integrated in SpectrIm.
rssrss
FacebooktwitterlinkedinmailFacebooktwitterlinkedinmail
TRANSACT-ITN final software survey

TRANSACT-ITN 2017 software survey

If you are a user of either the jMRUI software, the INTERPRET Decision Support System or the SpectraClassifier tool, we would like to know how you use these software tools and your opinion about them, so that we can keep improving our software to better serve your needs.

For that purpose, we ask you to participate in the TRANSACT-ITN final software survey by answering few questions about your training, your working environment, the data you process, and how you use and rate the software. Although most questions are mandatory, many are so trivial that you will answer them in a blink, and the full questionnaire should take you less than 15 minutes to complete, and less than 10 minutes if you only use the jMRUI software. The questionnaire has been tested with the most popular web browsers running on desktop computers and mobile phones and tablets, and you should be able to answer it from elsewhere.

The survey is brought to you by TRANSACT, the EU-funded FP7-PEOPLE Marie Curie Initial Training Network (ITN) project that has been fostering the development of the jMRUI software from March 1, 2013 to February 28, 2017. The aim of the project was to Transform Magnetic Resonance Spectroscopy into a Clinical Tool, and two of the main objectives of the project were:

Once the survey is over, a report summarizing all collected answers will be written and made available through the TRANSACT web site and/or this site.

We thank you in advance for your cooperation!

Picture “Survey” by NY, used under CC-BY-SA 3.0 / Cropped from original

rssrss
FacebooktwitterlinkedinmailFacebooktwitterlinkedinmail
jMRUI 6.0 beta

jMRUI 6.0 beta released

A new version of jMRUI is available!

We are happy to announce the beta release of the new jMRUI version 6.0 for testing purposes.

Before releasing the final version, we would like to ask you to help us to test this beta version. If you decide to help us, please, download the installation file for Microsoft Windows and/or GNU/Linux from the beta version download page, and  test all the functionalities you usually use, but also try the new features, and report any problems encountered and/or send suggestions either to the jMRUI forum or by email to with the subject “jmrui 6.0 beta report”.

This new version comes loaded with many improvements and new features, amongst the most important:

  • Combined analysis of MR Spectroscopy and Imaging (SpectrIm), currently available for Siemens Advanced DICOM format. Philips DICOM data format is being implemented, but not yet included in this version. For testing purposes you can download some example data sets from the jMRUI download web page.
  • QuasarX (Quest with some new constraints, such as common damping for selected metabolites, fixed frequency shift of selected metabolites, shape peak selection);
  • New history-tracking mode that allows (1) to retrieve all processing steps that led to the creation of a particular data/result, and thus increases the reproducibility and documentability of all processing steps; and (2) to run macros in the interactive mode.
  • New plugins SpectraClassifier and INTERPRET Decision-Support System for spectra classification and pattern recognition. These plugins are compatible with jMRUI v. 5.2 and they are distributed separatedly under their own license terms.
  • New plugin jMRUI2XML for automating MRS processing and for exchanging data. This plugin is compatible with jMRUI v. 5.2 and it is distributed separatedly under its own license terms.
  • Improved version of the spin system simulator NMRScopeB – new protocols (SPECIAL, MEGA-PRESS, semi-LASER), possibility to choose a pulse shape directly in the protocol window (no more need to modify the Python script) and many other improvements;

We thank you for helping us to make the code better.

rssrss
FacebooktwitterlinkedinmailFacebooktwitterlinkedinmail
Improved import plug-ins of GE and Siemens data-sets

GE and Siemens format update

Updated plug-ins for loading GE and Siemens data sets are now available. If you experienced any problems with any of those two data types, please download and update the plug-ins in your jMRUI installation.

Installation

  1. Before proceeding please make a copy of GE and Siemens plug-ins in any external directory
  2. Copy the plug-ins to “<jmrui_root>\plugins” folder; in case of the ge.jar file replace the original one by the new one. Note: you must not leave the copy of the original ge.jar file in the  “<jmrui_root>\plugins” folder together with the new one.

Download

Download GE_Siemens_Update-1.zip (25.4 KB)

Troubleshooting

If the problem with Siemens Dicom persists, please load the data file using “File/Open As” and select “Siemens DICOM”.

rssrss
FacebooktwitterlinkedinmailFacebooktwitterlinkedinmail
jMRUI 5.2

jMRUI 5.2 released

New version of jMRUI 5.2 is available.

New plug-ins

  • jMRUI2XML – extends the functionality of jMRUI by automating to a certain degree spectral preprocessing along with some algorithms that were not previously present in jMRUI. Purpose: data preprocessing for classification. Downloadable as a separate plug-in from http://gabrmn.uab.es/?q=jmrui2xml
  • SpectraClassifier – is built for designing and implementing Magnetic Resonance Spectroscopy (MRS)-based classifiers. The main goal of SC is to allow users with minimum background knowledge of multivariate statistics to perform a fully automated pattern recognition analysis. Downloadable as a separate plug-in from http://gabrmn.uab.es/?q=sc
  • InterpretDSS –   allows radiologists, medical physicists, biochemists or, generally speaking, any person with a minimum knowledge of what an MR spectrum is, to enter their own raw data, acquired at 1.5 T, and to analyze them. The system is expected to help in the categorization of MR Spectra from abnormal brain masses.  Downloadable as a separate plug-in from http://gabrmn.uab.es/?q=dss
  • Monte Carlo modeling  (for quantification results), available in Linux.

Improvements

QUEST / AQSES

  • Visualization of a basis set overlaid over a spectrum (Shift-TAB mode) has been improved:
    1. A metabolite that has been shifted interactively can be correctly shifted again into a new position.
    2. Multiple metabolites can be displayed at the same time over the quantified spectrum.
    3. Zoom is kept when a new metabolite is selected.
    4. When zoomed, analysed and metabolite spectra can be scrolled and the invisible part of the spectrum can be brought to the window with the same frequency scaling (by dragging the spectrum with mouse and SHIFT key pressed).
  • The frequency axes of the basis set and of the spectrum to be fitted are automatically aligned if both the basis set and the spectrum have been calibrated (a basis set is calibrated in NMRScopeB automatically).
  • The metabolite list is saved with parameters such as reference frequency, transmitter frequency and SW (which can be loaded to 1D mode as regular set of spectra).
  • Metabolites stored in the list (.ml format) can be additionally  processed in a 1D window and saved in “.ml” format from the 1D window.
  • S/N added to the result protocol.
  • Normalization is now an action, not a permanent change to the basis set.

QUEST / AQSES / AMARES

  • Quantitation results can be saved as a set of estimated metabolites in “.mrui” format and also passed to the 1D window, and so each individual estimated component (metabolite) can be additionally analysed.

AMARES

  • The database can be saved as a text file, the binary format is described.
  • Results: the Gaussian linewidth is exported correctly into the text file.
  • Results: the linewidths and their standard deviations in the results txt file are positive numbers.
  • Prior knowledge: the linewidth for the Gaussian-shaped model peak is corrected.
  • Peak picking works correctly after opening AMARES for the second time during one fitting session.

 NMRScopeB

  • Code implemented in Python.
  • Runs also in GNU/Linux.
  • A new protocol for the SPECIAL sequence.
  • Simulated FIDs can be integrated and/or multiplied by a user defined function (for simulation of VOI selection, inhomogeneous excitation, chemical-shift effect).
  • A new calibration constant was added  into a protocol; simulated FIDs  are divided by this constant in order to facilitate mixing simulated and measured signals in basis sets;  normalization is unnecessary in QUEST for data simulated with NMRScopeB.
  • Improved graphical visualization of sequences, possibility of export in vector graphics formats.
  • New interface:  multiple metabolites can be selected and simulated together (similar user comfort as in NMRScope).
  • Simulated metabolites can be saved in a metabolite list and loaded directly in QUEST/AQSES as a new basis set (no need to create manually a list of metabolites from individually simulated metabolites).
  • All information such as reference frequency, transmitter frequency and SW is saved in the metabolite list.
  • Metabolites stored in the list (.ml format) can be additionally apodized (for T2* effect) and saved in .ml format in 1D window (outside NMRScopeB).
  • NMRScopeB can be used in a batch mode.
  • More instances of NMRScopeB can be used at a time.
  • Simulated signals can be stored in vector graphics formats, e.g. Windows Metafiles, SVG, etc. for export to document.
  • Protocols are saved with all corresponding files.

Data formats

  • Data formats are recognized automatically, the data format (vendor) does not have to be selected by the user (Open button).
  • Possibility to load more spectra from different directories into 1D mode at the same time for Bruker data format.
  • MRSI Siemens “.rda” data are loaded with information about its orientation, and metabolite images are overlaid over an anatomical image in the correct spatial position.
  • jMRUI v3 format can be loaded.

 Preprocessing

  • Group delay and digital-filter transient correction (automated for the Bruker data format).
  • “ER Filter” fixed  for  multiple spectra.
  • Apodization filter width is defined as the full linewidth at half its maximum, not by damping factors.
  • Phase correction was significantly speeded-up for multiple spectra.
  • HLSVD – the Cancel button cancels the dialogue without performing HLSVD.
  • New possibility to average selected signals.

Signal simulation

  • Noise can be simulated even without signal (it is defined by its effective value, not as percentage of the signal amplitude).
  • The simulated signal can have parameter alpha and beta both set to 0 (for the simulation of a constant signal).

General improvements

  • Graphs of spectra/signals and quantification results can be stored in vector graphics formats (Print/Export, button Save to HTML);  Windows Metafile, SVG and other formats are saved together with HTML.
  • Zoomed spectra/signals can be scrolled together with the frequency/time axis (by dragging the spectrum with mouse and SHIFT key pressed), hidden parts are brought to display without changing the zoom.
  • The precision of the cursor position display in ppm/Hz can be set in Options (define the number of decimal digits), display of either the nearest sample or an interpolated value can be selected.
  • The automated FID/ECHO identification, based on signal maximum position, can be switched off (in Options).
  • CSI of non-square spatial matrix size can be loaded.
  • Further small improvements and bugs fixed.
rssrss
FacebooktwitterlinkedinmailFacebooktwitterlinkedinmail