Free of charge; 25.11.2024, 2pm – 6:15 pm CET; online
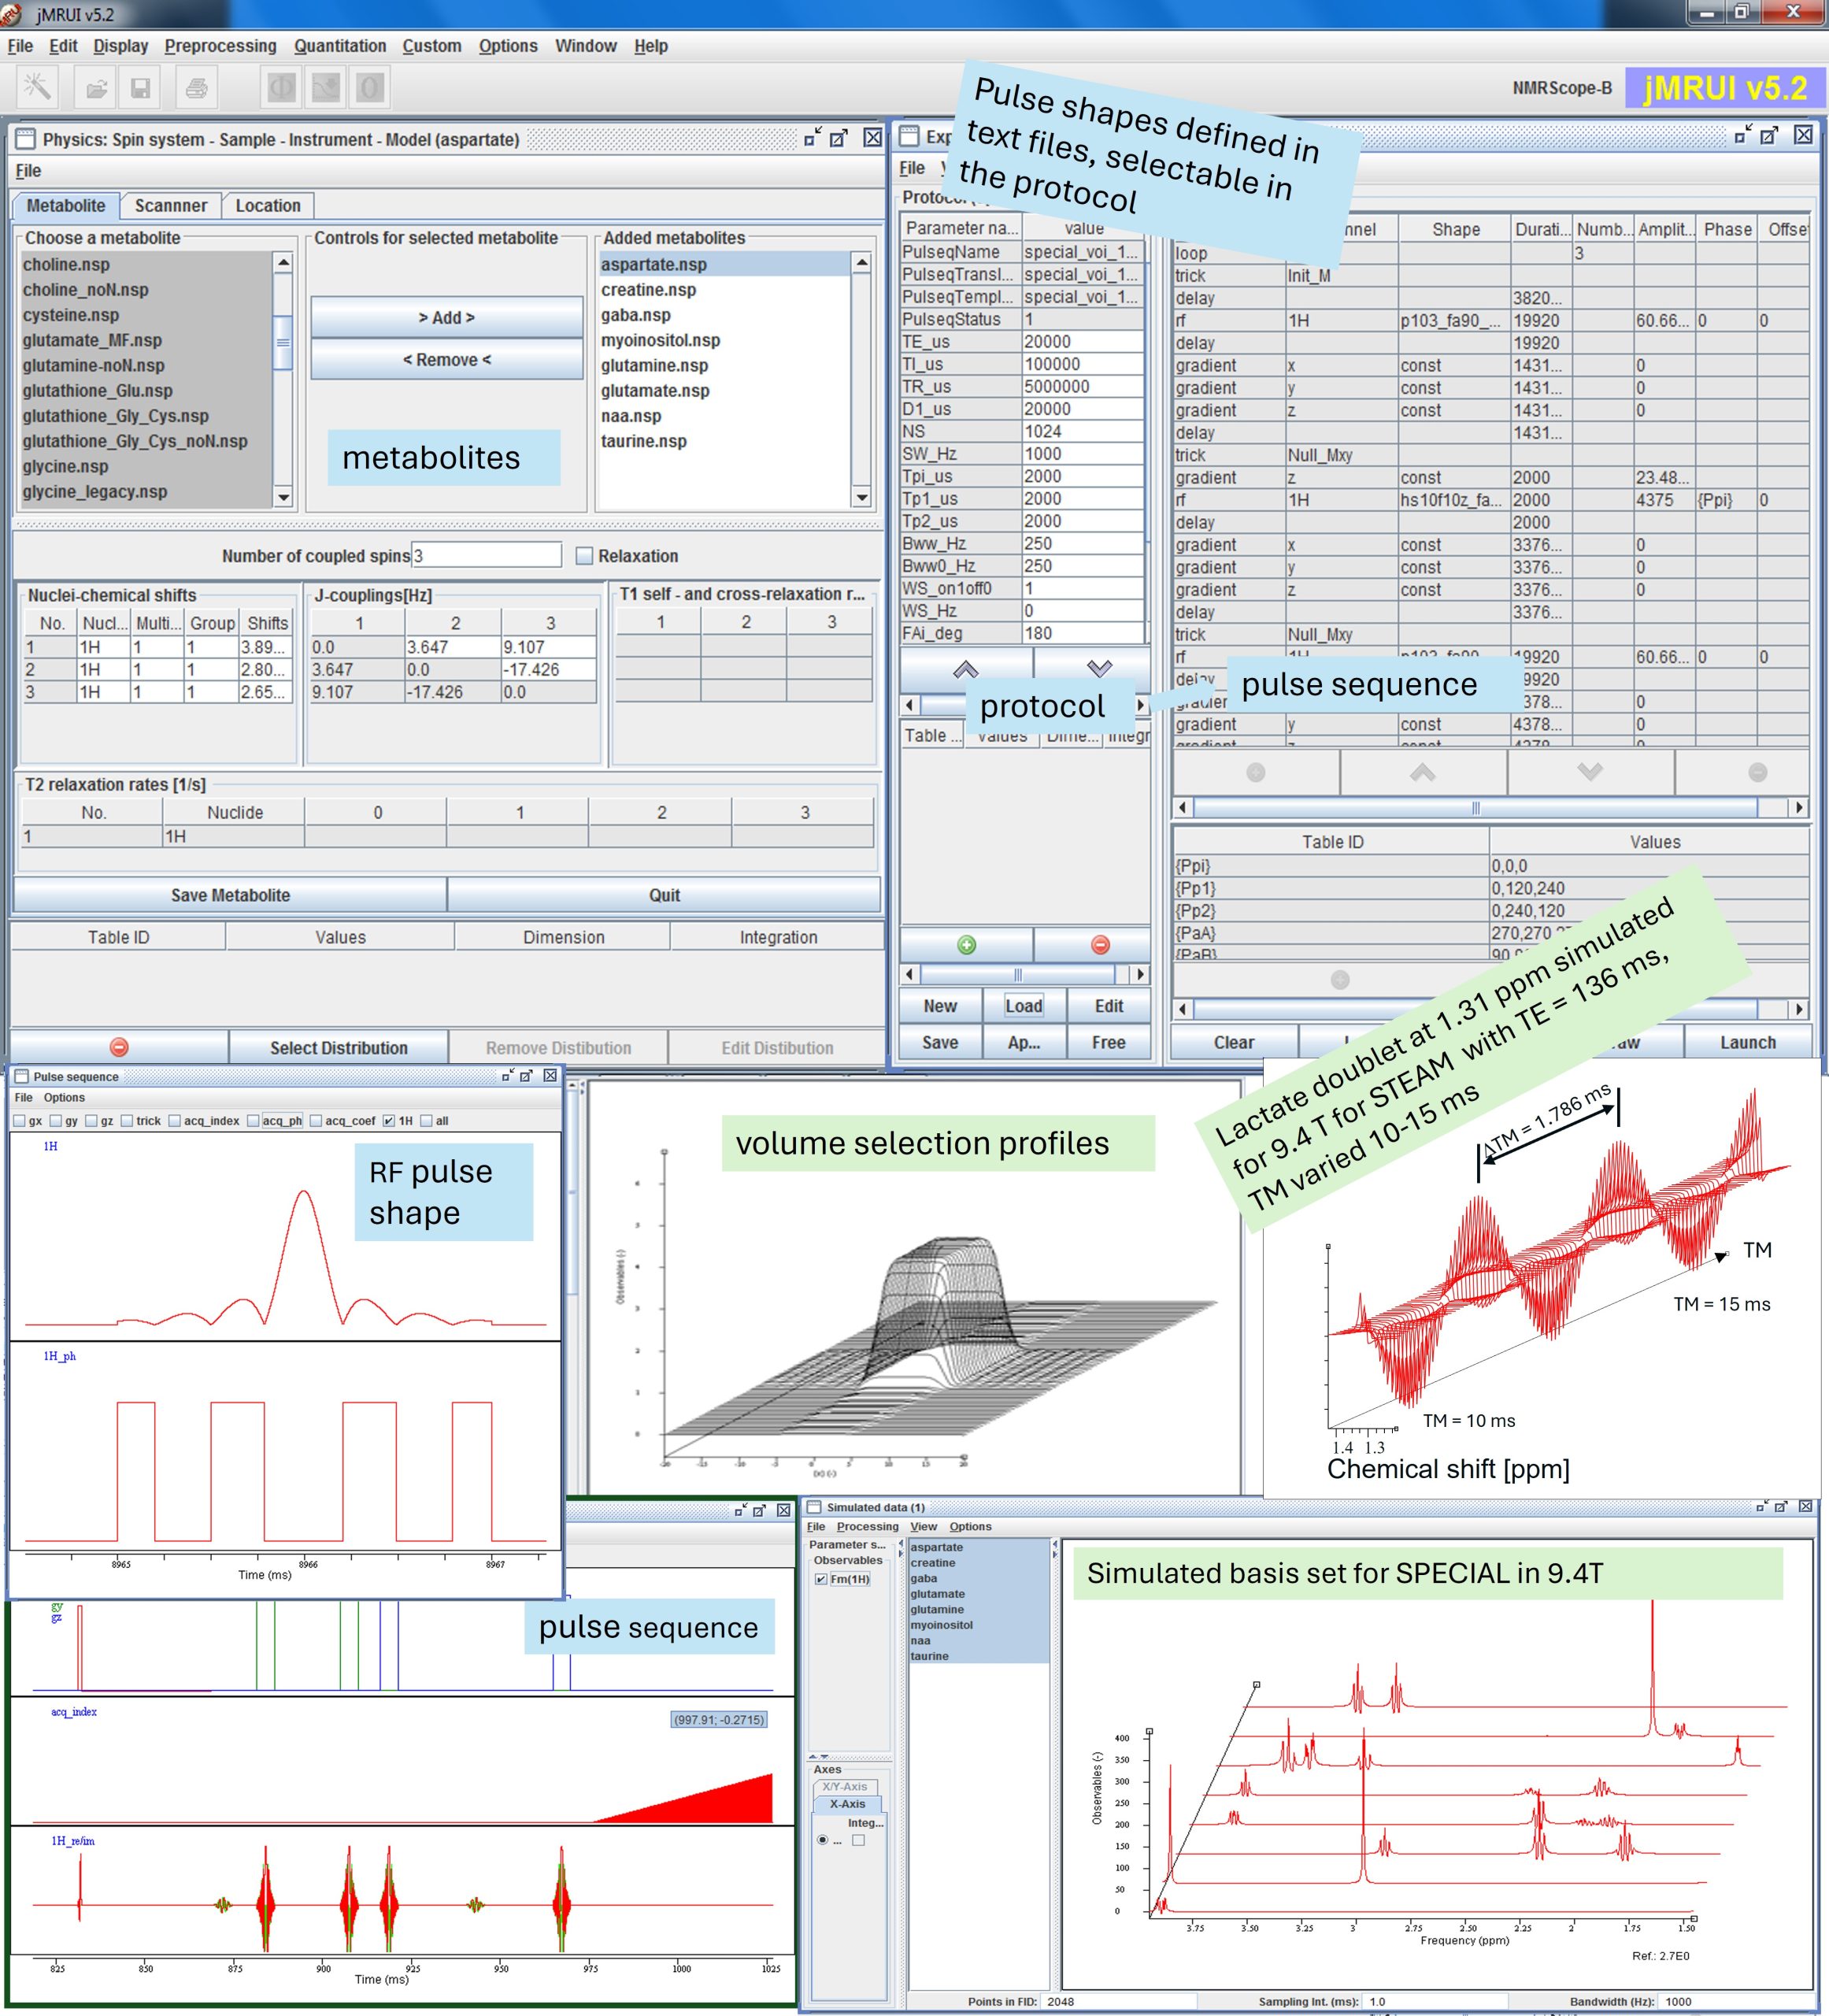
This course will offer in-depth training on simulating metabolite signals using the NMRScopeB spin system simulator, part of the jMRUI software package, and assembling metabolite basis set for metabolite concentration estimation in jMRUI or other software packages. Attendees will learn to choose the right metabolite models, set up pulse sequences and parameters matching real-world MR acquisition protocols, and apply them in concentration estimation. Advanced participants will gain hands-on experience in modifying pulse sequences, pulse shapes and protocols in the simulator for enhanced flexibility in experimental design. Finally, applications of the simulator in MR study and method development will be demonstrated.


