Category Archives: Releases

jMRUI 6.0 beta

jMRUI 6.0 beta released

A new version of jMRUI is available!

We are happy to announce the beta release of the new jMRUI version 6.0 for testing purposes.

Before releasing the final version, we would like to ask you to help us to test this beta version. If you decide to help us, please, download the installation file for Microsoft Windows and/or GNU/Linux from the beta version download page, and  test all the functionalities you usually use, but also try the new features, and report any problems encountered and/or send suggestions either to the jMRUI forum or by email to with the subject “jmrui 6.0 beta report”.

This new version comes loaded with many improvements and new features, amongst the most important:

  • Combined analysis of MR Spectroscopy and Imaging (SpectrIm), currently available for Siemens Advanced DICOM format. Philips DICOM data format is being implemented, but not yet included in this version. For testing purposes you can download some example data sets from the jMRUI download web page.
  • QuasarX (Quest with some new constraints, such as common damping for selected metabolites, fixed frequency shift of selected metabolites, shape peak selection);
  • New history-tracking mode that allows (1) to retrieve all processing steps that led to the creation of a particular data/result, and thus increases the reproducibility and documentability of all processing steps; and (2) to run macros in the interactive mode.
  • New plugins SpectraClassifier and INTERPRET Decision-Support System for spectra classification and pattern recognition. These plugins are compatible with jMRUI v. 5.2 and they are distributed separatedly under their own license terms.
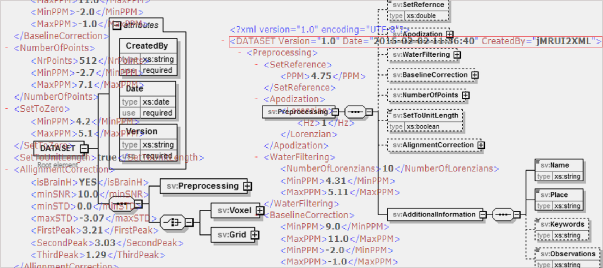
  • New plugin jMRUI2XML for automating MRS processing and for exchanging data. This plugin is compatible with jMRUI v. 5.2 and it is distributed separatedly under its own license terms.
  • Improved version of the spin system simulator NMRScopeB – new protocols (SPECIAL, MEGA-PRESS, semi-LASER), possibility to choose a pulse shape directly in the protocol window (no more need to modify the Python script) and many other improvements;

We thank you for helping us to make the code better.

rssrss
FacebooktwitterlinkedinmailFacebooktwitterlinkedinmail
jmrui2xml plugin

The jMRUI2XML plugin is reported in BMC Bioinformatics

From raw data to data-analysis for magnetic resonance spectroscopy – the missing link: jMRUI2XML.
Victor Mocioiu, Sandra Ortega-Martorell, Iván Olier, Michal Jablonski, Jana Starcukova, Paulo Lisboa, Carles Arús and Margarida Julià-Sapé.
BMC Bioinformatics
2015, 16:378
DOI: 10.1186/s12859-015-0796-5

Abstract

Background

Magnetic resonance spectroscopy provides metabolic information about living tissues in a non-invasive way. However, there are only few multi-centre clinical studies, mostly performed on a single scanner model or data format, as there is no flexible way of documenting and exchanging processed magnetic resonance spectroscopy data in digital format. This is because the DICOM standard for spectroscopy deals with unprocessed data.

The paper proposes a plugin tool developed for jMRUI, namely jMRUI2XML, to tackle the latter limitation, given that jMRUI has evolved into a plugin platform allowing for implementation of novel features.

Results

jMRUI2XML is a Java solution that facilitates common preprocessing of magnetic resonance spectroscopy data across multiple scanners. Its main characteristics are: 1) it automates magnetic resonance spectroscopy preprocessing, and 2) it can be a platform for outputting exchangeable magnetic resonance spectroscopy data. The plugin works with any kind of data that can be opened by jMRUI and outputs in extensible markup language format. Data processing templates can be generated and saved for later use.

The output format opens the way for easy data sharing- due to the documentation of the preprocessing parameters and the intrinsic anonymization – for example for performing pattern recognition analysis on multicentre/multi-manufacturer magnetic resonance spectroscopy data.

Conclusions

jMRUI2XML provides a self-contained and self-descriptive format accounting for the most relevant information needed for exchanging magnetic resonance spectroscopy data in digital form, as well as for automating its processing. This allows for tracking the procedures the data has undergone, which makes the proposed tool especially useful when performing pattern recognition analysis. Moreover, this work constitutes a first proposal for a minimum amount of information that should accompany any magnetic resonance processed spectrum, towards the goal of achieving better transferability of magnetic resonance spectroscopy studies.

rssrss
FacebooktwitterlinkedinmailFacebooktwitterlinkedinmail
jMRUI 5.2

jMRUI 5.2 released

New version of jMRUI 5.2 is available.

New plug-ins

  • jMRUI2XML – extends the functionality of jMRUI by automating to a certain degree spectral preprocessing along with some algorithms that were not previously present in jMRUI. Purpose: data preprocessing for classification. Downloadable as a separate plug-in from http://gabrmn.uab.es/?q=jmrui2xml
  • SpectraClassifier – is built for designing and implementing Magnetic Resonance Spectroscopy (MRS)-based classifiers. The main goal of SC is to allow users with minimum background knowledge of multivariate statistics to perform a fully automated pattern recognition analysis. Downloadable as a separate plug-in from http://gabrmn.uab.es/?q=sc
  • InterpretDSS –   allows radiologists, medical physicists, biochemists or, generally speaking, any person with a minimum knowledge of what an MR spectrum is, to enter their own raw data, acquired at 1.5 T, and to analyze them. The system is expected to help in the categorization of MR Spectra from abnormal brain masses.  Downloadable as a separate plug-in from http://gabrmn.uab.es/?q=dss
  • Monte Carlo modeling  (for quantification results), available in Linux.

Improvements

QUEST / AQSES

  • Visualization of a basis set overlaid over a spectrum (Shift-TAB mode) has been improved:
    1. A metabolite that has been shifted interactively can be correctly shifted again into a new position.
    2. Multiple metabolites can be displayed at the same time over the quantified spectrum.
    3. Zoom is kept when a new metabolite is selected.
    4. When zoomed, analysed and metabolite spectra can be scrolled and the invisible part of the spectrum can be brought to the window with the same frequency scaling (by dragging the spectrum with mouse and SHIFT key pressed).
  • The frequency axes of the basis set and of the spectrum to be fitted are automatically aligned if both the basis set and the spectrum have been calibrated (a basis set is calibrated in NMRScopeB automatically).
  • The metabolite list is saved with parameters such as reference frequency, transmitter frequency and SW (which can be loaded to 1D mode as regular set of spectra).
  • Metabolites stored in the list (.ml format) can be additionally  processed in a 1D window and saved in “.ml” format from the 1D window.
  • S/N added to the result protocol.
  • Normalization is now an action, not a permanent change to the basis set.

QUEST / AQSES / AMARES

  • Quantitation results can be saved as a set of estimated metabolites in “.mrui” format and also passed to the 1D window, and so each individual estimated component (metabolite) can be additionally analysed.

AMARES

  • The database can be saved as a text file, the binary format is described.
  • Results: the Gaussian linewidth is exported correctly into the text file.
  • Results: the linewidths and their standard deviations in the results txt file are positive numbers.
  • Prior knowledge: the linewidth for the Gaussian-shaped model peak is corrected.
  • Peak picking works correctly after opening AMARES for the second time during one fitting session.

 NMRScopeB

  • Code implemented in Python.
  • Runs also in GNU/Linux.
  • A new protocol for the SPECIAL sequence.
  • Simulated FIDs can be integrated and/or multiplied by a user defined function (for simulation of VOI selection, inhomogeneous excitation, chemical-shift effect).
  • A new calibration constant was added  into a protocol; simulated FIDs  are divided by this constant in order to facilitate mixing simulated and measured signals in basis sets;  normalization is unnecessary in QUEST for data simulated with NMRScopeB.
  • Improved graphical visualization of sequences, possibility of export in vector graphics formats.
  • New interface:  multiple metabolites can be selected and simulated together (similar user comfort as in NMRScope).
  • Simulated metabolites can be saved in a metabolite list and loaded directly in QUEST/AQSES as a new basis set (no need to create manually a list of metabolites from individually simulated metabolites).
  • All information such as reference frequency, transmitter frequency and SW is saved in the metabolite list.
  • Metabolites stored in the list (.ml format) can be additionally apodized (for T2* effect) and saved in .ml format in 1D window (outside NMRScopeB).
  • NMRScopeB can be used in a batch mode.
  • More instances of NMRScopeB can be used at a time.
  • Simulated signals can be stored in vector graphics formats, e.g. Windows Metafiles, SVG, etc. for export to document.
  • Protocols are saved with all corresponding files.

Data formats

  • Data formats are recognized automatically, the data format (vendor) does not have to be selected by the user (Open button).
  • Possibility to load more spectra from different directories into 1D mode at the same time for Bruker data format.
  • MRSI Siemens “.rda” data are loaded with information about its orientation, and metabolite images are overlaid over an anatomical image in the correct spatial position.
  • jMRUI v3 format can be loaded.

 Preprocessing

  • Group delay and digital-filter transient correction (automated for the Bruker data format).
  • “ER Filter” fixed  for  multiple spectra.
  • Apodization filter width is defined as the full linewidth at half its maximum, not by damping factors.
  • Phase correction was significantly speeded-up for multiple spectra.
  • HLSVD – the Cancel button cancels the dialogue without performing HLSVD.
  • New possibility to average selected signals.

Signal simulation

  • Noise can be simulated even without signal (it is defined by its effective value, not as percentage of the signal amplitude).
  • The simulated signal can have parameter alpha and beta both set to 0 (for the simulation of a constant signal).

General improvements

  • Graphs of spectra/signals and quantification results can be stored in vector graphics formats (Print/Export, button Save to HTML);  Windows Metafile, SVG and other formats are saved together with HTML.
  • Zoomed spectra/signals can be scrolled together with the frequency/time axis (by dragging the spectrum with mouse and SHIFT key pressed), hidden parts are brought to display without changing the zoom.
  • The precision of the cursor position display in ppm/Hz can be set in Options (define the number of decimal digits), display of either the nearest sample or an interpolated value can be selected.
  • The automated FID/ECHO identification, based on signal maximum position, can be switched off (in Options).
  • CSI of non-square spatial matrix size can be loaded.
  • Further small improvements and bugs fixed.
rssrss
FacebooktwitterlinkedinmailFacebooktwitterlinkedinmail